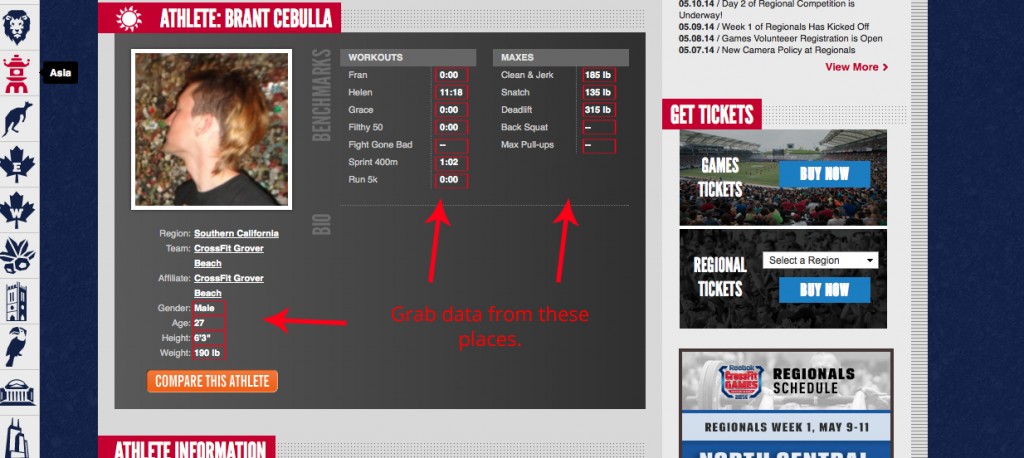
On a CrossFit Games athlete profile page, athletes can self-report their best marks for the following:
Athletes also self-report their gender, height, weight and age.
What I wanted to know is using these self-reported marks, what does the normal distribution look like for these marks? What’s an average time/weight? What’s a good time/weight?
While the goal in working out is to improve your own self, it’s still nice to know how you stack up compared to the rest of the world. Knowing what a weak time/weight is, what’s average and what’s good can help you focus on your weaknesses, help you understand your strengths, and help trainers evaluate their athletes, to better tailor training and ensure safety.
So I needed to pull data from the CrossFit Games’ website. To collect data off of the CrossFit Games’ website, I needed to use a technique called “web scraping.” Web scraping takes a look at web pages and collects specific text/data on those web pages and translates that data collection into spreadsheets and tables. What I needed to do is scrape data off of as many athletes’ pages within reason.
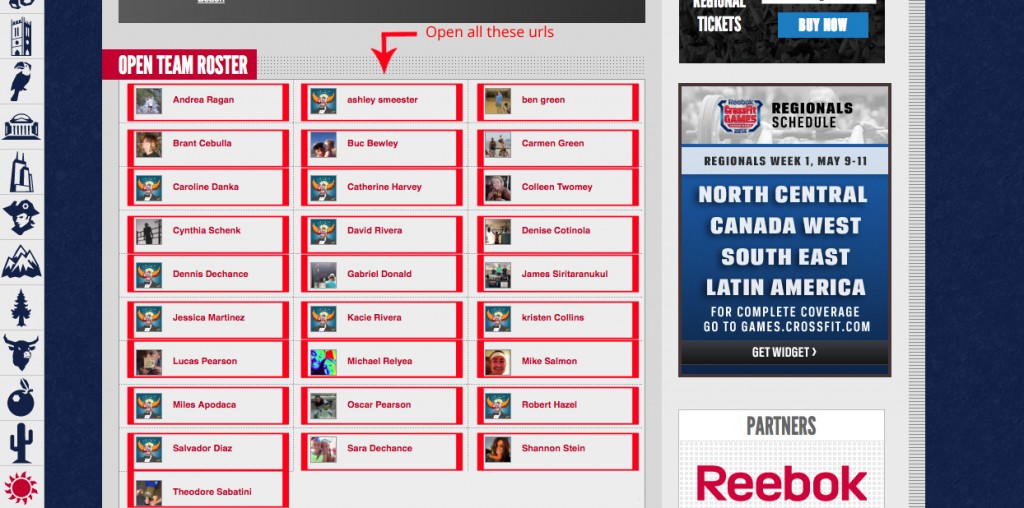
I used software called FMiner. In FMiner, I designed a data extraction project that worked like this:
In theory, this means the project would have loaded the urls of 300 CrossFit teams. However, some of the urls didn’t exist or didn’t have any athletes listed on those teams.
This method led to the extraction of data from 5,376 athletes. Of these athletes, 3,159 were male, 2,217 were female. I exported this data to Excel.
The majority of these athletes did not self-report their marks. After excluding athletes from the data that didn’t report any marks, there were 1,935 athletes, 1,301 of which were male, 634 female.
Notice the much larger percentage of men reporting marks than women. Out of the data I extracted, men made up 58.8% of the pool. Yet, after excluding people who didn’t do any self-reporting, men made up 67.2% of the pool.